Managing the portfolio#
Apply metric data to your applications.
Experimental features, such as the Insights portfolio feature, are disabled by default. To enable the feature, complete the following steps:
- On an active UrbanCode™ Velocity server, access
https://my_velocity:port/featureflags. - In the Enter a feature name to enable it field, enter
vsm-data-portfolio. If the process is successful, the feature is added to the Enabled Features list, and the Portfolio tab becomes available on the Insights page.
Note: Experimental features are provided for testing purposes. Experimental features might change at any time.
The Portfolio feature collects summary information about your applications in one place where you can apply metric-data charts to them. In UrbanCode Velocity, the term 'application' refers to processes integrated from tools such as UrbanCode Deploy, Jenkins, and SonarQube. You can also load applications into UrbanCode Velocity by using the API.
To add charts to applications, complete the following steps:
-
On the UrbanCode Velocity Home page, click Insights.
The Portfolio view is displayed.
-
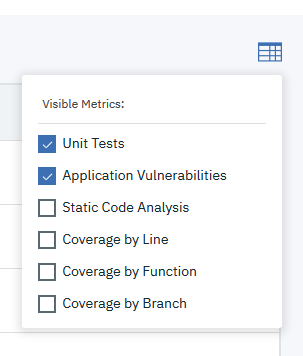
In the Portfolio view, click the Chart tool.
The Chart tool displays the charts that you can apply to the portfolio.

-
Select a chart that you want to apply to the applications, and then close the Visible metrics window.
The metrics chart is applied to the applications, and a column is added to the Portfolio view that displays the data.
Parent topic: Managing dashboards